Hiking Season

Why September 16 is a coin flip, why the long end has stopped taking its cue from the Fed, why cleaning up delinquency can make occupancy look worse first, and why the vintage in an OM is not a plain fact. Here is what stood out in August.
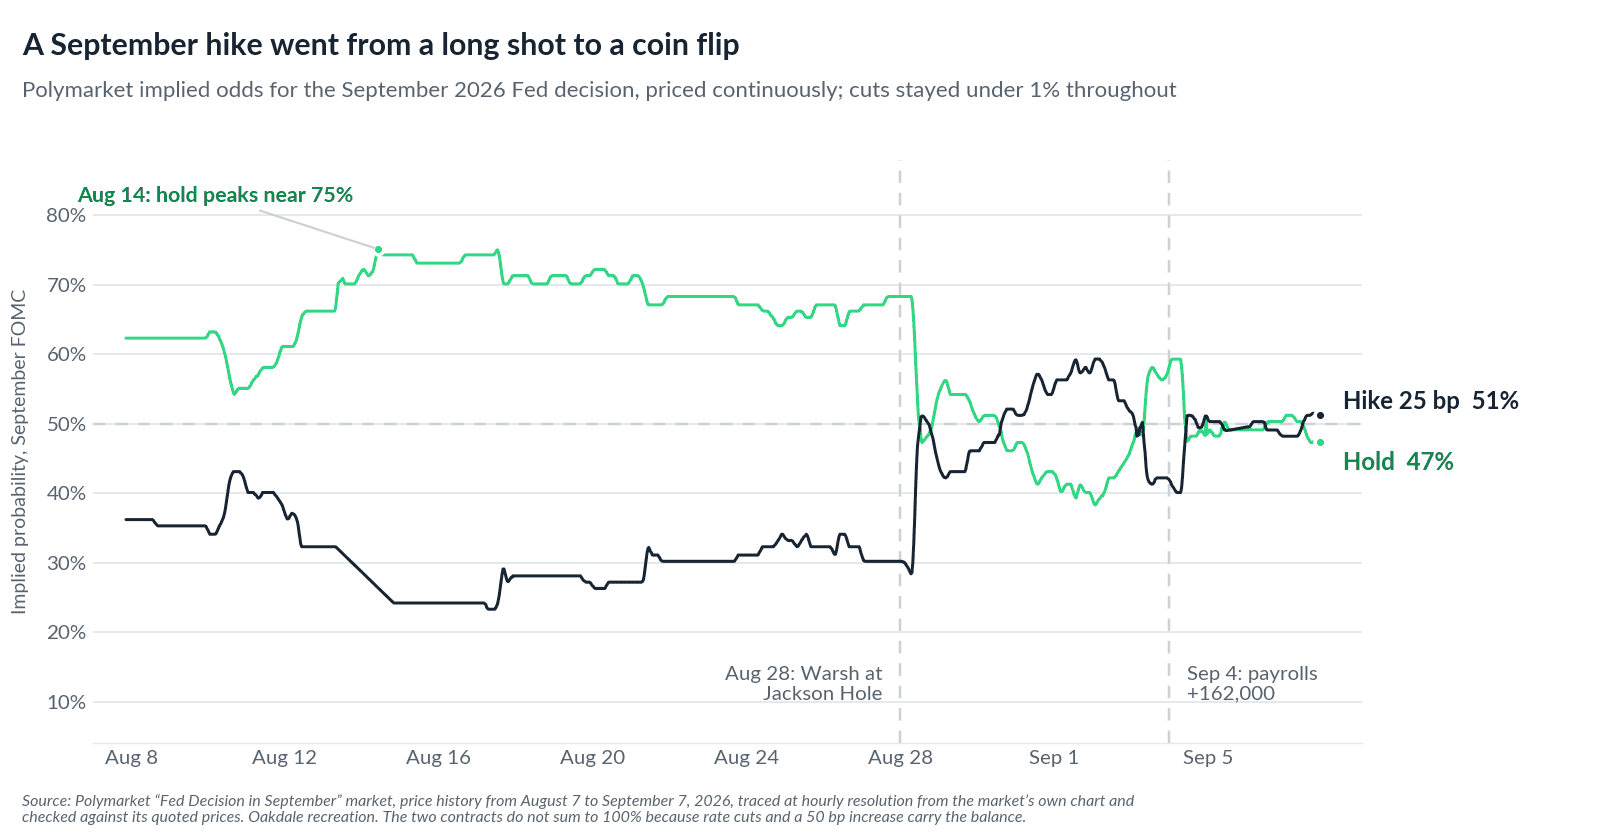
September went from a hold to a coin flip on a hike
On July 29, the Federal Open Market Committee held its benchmark rate at 3.50 to 3.75%, its fifth consecutive hold of 2026 [1]. Then on August 28, Fed Chair Kevin Warsh said at Jackson Hole that underlying inflation had not meaningfully improved, remarks markets read as hawkish and that materially increased September hike odds [2]. He has a case: core PCE ran at 3.3% in July and headline at 3.7%, both well above the 2% target [3].
The September 4 jobs report removed the strongest argument against him. August payrolls rose 162,000 against a prior twelve-month average of about 31,000, and the revisions mattered more: July, first reported as a 23,000 decline, was revised up by 44,000 into a gain [4].
Prediction markets repriced within hours and have not gone back. Polymarket’s September contract, which has traded more than $100 million in volume, had a hold near 75% on August 14 and closed the first week of September at roughly a coin flip. Kalshi was in the same place. Fed-funds futures currently lean toward a 25-basis-point hike, though the published reading swung between the mid-50s and about 70% inside a single week [5]. Cuts have not priced above 1% all month.
For our purposes, it barely matters which way September 16 lands. Freddie Mac’s large-balance multifamily loans priced at 5.90 to 6.05% for 5- to 15-year fixed terms in early September [6]. Call it 6%, and that is the number underwriting has to clear. A hike would not change what a property earns. It would directly raise short- and floating-rate borrowing costs, while for the fixed-rate agency loans we underwrite the effect is indirect: the all-in coupon moves with the Treasury curve and lender spreads, not mechanically with the federal funds rate.
September 16 moves the front end. Our coupon follows the curve. Either way, 6% is the number to clear.
The long end of the curve has stopped listening
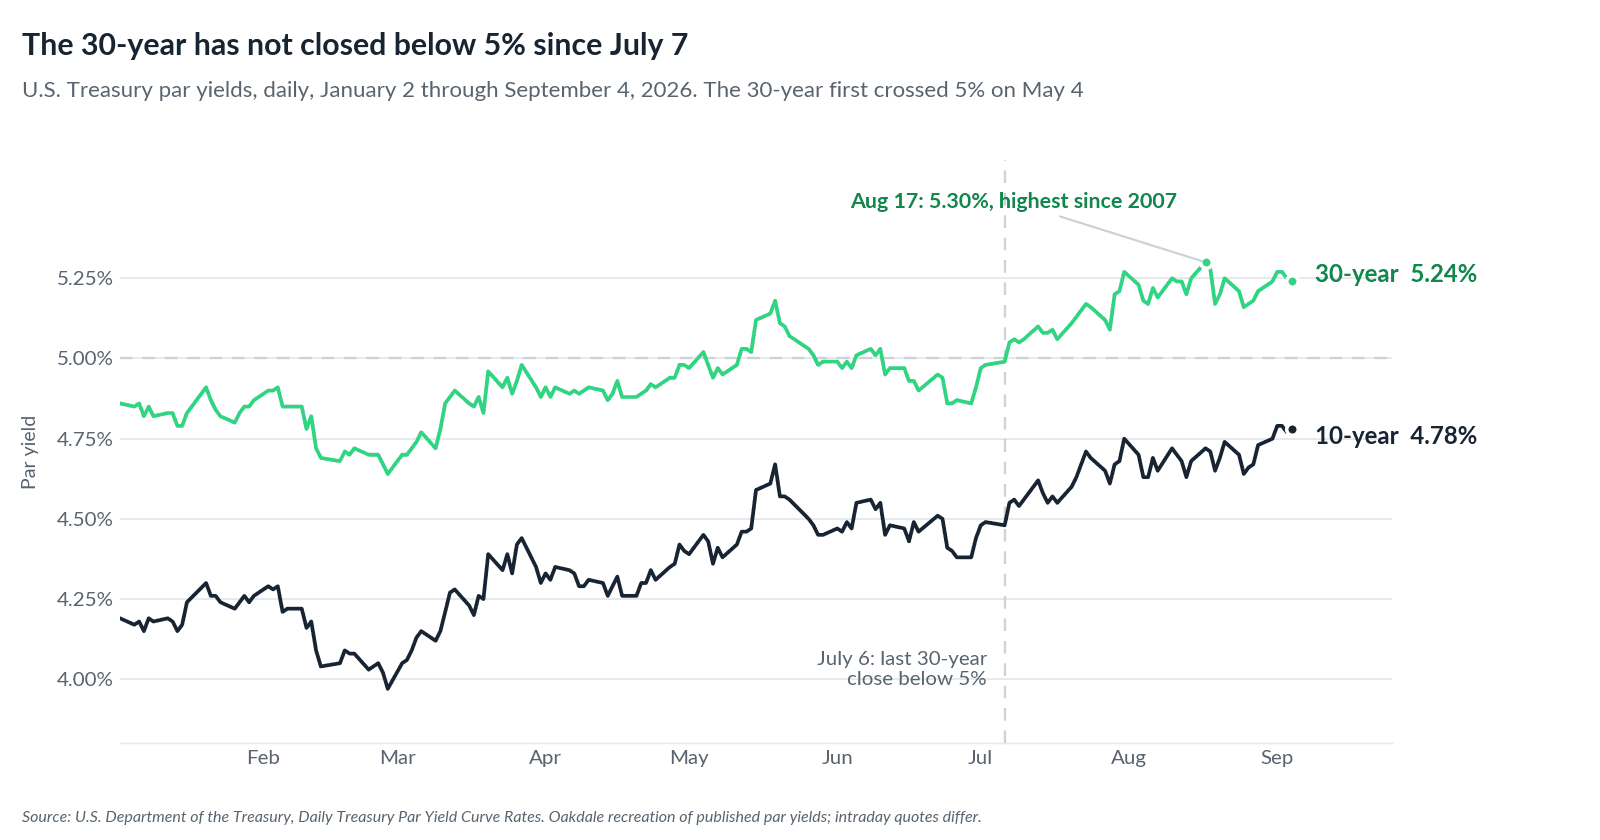
The more consequential rate is the one the Fed does not set. The 30-year Treasury closed at 5.24% on September 4 after touching 5.30% on August 17, its highest since 2007, and it has not closed below 5% since July 7 [7]. Bloomberg counts more days above 5% this year than in any year since 2006 [8]. The 10-year has risen more year-to-date, 59 basis points against the 30-year’s 38. What is unusual is how long the long end has stayed there.
Three forces are keeping it elevated. The first is supply: federal debt crossed $40 trillion in August, and the Congressional Budget Office raised this year’s deficit projection to $2.1 trillion, $200 billion above its February estimate [9]. The second is competition for the same buyer: over the past twelve months foreign private investors put $390 billion into U.S. corporate bonds against $329 billion into Treasuries [10]. The third is a premium for not knowing, now that the Fed has moved away from forward guidance [11]. Treasury has responded by at least doubling its long-end liquidity support buybacks from September 9, a step it frames as market functioning rather than a view on yields [12]. The 30-year yield fell about 10 basis points on the announcement and gave most of it back within days.
The two rates do different jobs. The Fed controls the overnight policy rate; our fixed coupon is a Treasury index plus a lender spread, and Freddie will let a borrower lock those two separately [13]. Longer Treasury yields matter for real estate values, but they do not pass through one for one to an exit cap rate. A cap rate also moves with expected NOI growth and with how much capital is competing for the asset. So, our conclusion is a narrow one: we are not relying on cap-rate compression to reach our base-case returns.
The Fed sets the overnight rate. The market sets the curve. We underwrite to both, not to a hoped-for cut.
Cleaning up delinquency can make occupancy look worse before it looks better
Take an illustrative case. A limited partner opens a quarterly report and finds two numbers on different pages. Occupancy has slipped from 94% to 88%. Current delinquency has fallen from 5.4% to 2.6%. The natural reading is that the first figure is the problem. Often, they are the same decision showing up twice, about a quarter apart.
An owner of a property carrying delinquent residents decides to stop letting the delinquency ride. Collect hard and you evict a portion of the tenancy, and those units sit empty through a court calendar nobody at the property controls. In our recent cases the practical timeline has stretched well past three months, against a statutory sequence that reads more like five or six weeks [14]. So the leverage an owner has is earlier in the process, at the decision to file at all. Filing on everyone who falls behind produces court cases and very little rent. We have found that a written promise to pay, a set amount by a set date, sorts the residents who can and will pay from those who cannot, and keeps more rent coming in than an immediate filing does.
The lesson is as much about reading a report as running a property. We now ask for the filing log and the eviction log alongside the rent roll. A property whose occupancy fell the quarter after its filings spiked is a cleanup in progress, and it reads as decline to anyone looking only at the first number.
When occupancy drops, ask whether a sponsor started collecting harder about three months earlier.
One of the most reliable revenue levers we have is a knock on the door
In October we wrote that when trade-out math gets tight, value creation shifts from rate growth to retention, expense control and basis discipline. The arithmetic is not close; a renewal at a market-rate increase costs phone calls, emails, texts and in-person visits. A move-out costs the make-ready, the vacant days and often a concession.
Renewal offers go out seventy-five to ninety days ahead of a sixty-day notice, then climb a ladder: the resident portal, email, a letter taped to the door, weekly texts and calls, and finally a leasing rep visiting the unit, taping a bag of popcorn to the door with a note reading “Just popped by to see you” if nobody is home.
At two properties we tracked this summer, pending renewals went from eleven to zero and from five to zero, and one afternoon of door knocking reached seven residents who all renewed. Retention across those properties is running 65 to 70% on renewal increases averaging 4 to 5%, against a comparable set our managers benchmark around 40%. That said, these are internal, unaudited observations rather than a controlled comparison [15].
The final direct-contact steps produced many of the last conversions, so we track in-person contacts per renewal cycle rather than notices sent. And retention is not comparable across property management reports: drop evicted residents and skips out of the denominator and a portfolio scores higher without anyone having stayed, so ask whether those two are counted.
Retention shows up as one number with nothing about how it got there. It is the output of a six-step sequence, and the steps that take a person are the ones that close it.
For older assets, the material matters more than the year in the OM
At Oakdale, we stand behind the case for vintage yield: 1970s through 2000s assets at a defensible basis. But we don’t as often dive into what that vintage is physically made of, and a band that wide spans more than one plumbing era.
“1971” matters less than “cast iron drains at end of life,” which sets your capital expense for the next five years. Cast iron drain and sewer pipe carries an expected service life of about fifty years, shortened by drain cleaners, soil movement and scaling, though plenty of older cast iron still works and condition depends on how it was installed, what soil it sits in and what repairs it has had. Cast iron also gave way to plastic in residential drain lines through the mid-1970s, so a 1971 building and a 1995 building are not the same asset [16].
So age alone does not decide replacement. It decides that you inspect, and jetting or replacement goes on the capital plan when the camera says so. That avoids the emergency version, where a six-foot section can run $3,000 because you cannot solicit three bids while residents have no working plumbing.
The year built quoted in an OM is not always a fact either. An asset in our pipeline was marketed as 1986 vintage, but the county assessor record suggests some of the buildings went up in 1972 or 1973, a fourteen-year gap the OM does not mention.
Underwrite the materials. Ask for the assessor record per building and run a sewer scope camera.
Closing Thought
This month’s stories divide into what we control and what we don’t. We do not control the Fed on September 16, or a 30-year Treasury that has stopped taking direction from it. We do control the collections decision that shows up in an occupancy number a quarter later, the door knock that turned eleven pending renewals into zero, and the assessor record that flagged a fourteen-year gap in a stated year built. When debt costs near 6% and the long end shows no sign of falling, price discipline at entry is most of the return.
As always, please reach out with questions or to discuss what we’re seeing in our active markets.
Sources
Federal Reserve, “Federal Reserve issues FOMC statement” and Implementation Note, July 29, 2026 (federal funds target range maintained at 3.50 to 3.75%, effective July 30, 2026), the fifth consecutive hold of 2026. federalreserve.gov/newsevents/pressreleases/monetary20260729a.htm
Kevin Warsh, keynote remarks at the 2026 Jackson Hole Economic Policy Symposium, August 28, 2026, and CNBC, “September Fed decision is now a coin flip as rate hike odds increase post Warsh,” August 28, 2026. federalreserve.gov/newsevents/speech/warsh20260828a.htm · cnbc.com
U.S. Bureau of Economic Analysis, Personal Income and Outlays, July 2026, released August 26, 2026 (headline PCE price index up 3.7% year over year and 0.2% on the month; core PCE up 3.3% year over year and 0.2% on the month). bea.gov/news/2026/personal-income-and-outlays-july-2026
U.S. Bureau of Labor Statistics, Employment Situation, August 2026, released September 4, 2026 (nonfarm payrolls up 162,000 against a prior twelve-month average of 31,000; unemployment 4.1%; average hourly earnings up 3.1% year over year; June revised up 11,000 and July revised up 44,000, from a reported decline of 23,000 to a gain of 21,000). bls.gov/news.release/archives/empsit_09042026.htm
Polymarket, “Fed Decision in September” market, accessed September 7, 2026 (25 basis point increase near 51%, no change near 47%, decreases under 1%, on more than $102 million of volume; a hold peaking near 75% on August 14). The chart is an Oakdale recreation of the market’s own price history, traced at hourly resolution and checked against the market’s quoted prices; the two contracts do not sum to 100% because rate cuts and a 50 basis point increase carry the balance. Kalshi, September FOMC market, same period (hike near 51%). Published CME Group federal funds futures probabilities for the same meeting varied widely by source and date within one week: about 66% (Forbes, August 31), about 70% (CME data reported September 3), and 55.6% (Central Bank Watch, September 4). All of these are point-in-time readings that move continuously and are not restated here as a single figure. polymarket.com · kalshi.com
Freddie Mac Multifamily, rate sheet for large-balance loans of $10 million and above, accessed September 1, 2026 (5- to 15-year fixed terms priced at 5.90 to 6.05%). Corroborating market quotes for the week of September 1, 2026 (agency five-year fixed 5.95%, agency ten-year fixed 6.00%) from Multi-Family USA, Multifamily Lending Rates. Quoted pricing varies by tenor, leverage and prepayment structure, so “about 6%” is the level, not a single quotable rate. mf.freddiemac.com · multifamily-usa.com
U.S. Department of the Treasury, Daily Treasury Par Yield Curve Rates (September 4, 2026: 10-year 4.78%, 30-year 5.24%; August 17, 2026: 30-year 5.30%, the highest par yield reading since 2007; January 2, 2026: 10-year 4.19%, 30-year 4.86%). The 30-year first closed above 5% on May 4, 2026 and its last close below 5% was July 6, 2026, on 4.99%. Year-to-date changes and the day counts are Oakdale’s own calculations from that published series, which the chart plots in full from January 2 through September 4, 2026. Intraday and secondary market quotes run above the par curve; figures here use one convention throughout. home.treasury.gov
Bloomberg via Advisor Perspectives, “US 30-Year Bond Enters September on Worst Stretch Since 2006,” September 1, 2026 (30-year above 5% on 55 days through August 31, the most of any year since 2006, and the weakest long-bond performance stretch since 2006). advisorperspectives.com/articles/2026/09/01/us-30-year-enters-september-worst-stretch
Congressional Budget Office, Monthly Budget Review: July 2026 (fiscal 2026 deficit estimate of about $2.1 trillion, roughly $200 billion above the February baseline), and CBS News, “National debt tops $40 trillion after doubling in less than a decade,” August 2026. cbo.gov/publication/61983 · cbsnews.com
Axios, “Big Tech’s borrowing binge gives Treasury bonds competition,” August 25, 2026 (foreign private investors placing $390 billion into U.S. corporate bonds versus $329 billion into Treasuries over the trailing twelve months; investment grade corporate issuance of about $1.36 trillion through July 2026, up 27% year over year, much of it financing data-center construction). axios.com/2026/08/25/ai-debt-treasury-yields
Axios, “What rising Treasury yields are telling us,” August 17, 2026, on the volatility premium attributed to the Federal Reserve stepping back from forward guidance, quoting Mark Cabana of BofA Global Research: “There is literally a price to be paid for the lack of guidance.” axios.com/2026/08/17/treasury-yields-warsh-bonds
U.S. Department of the Treasury, “Treasury Announces Increased Sizes of Nominal Long-End Liquidity Support Buybacks Beginning September 9,” 2026 (maximum operation size raised from $2 billion to at least $4 billion in the 10- to 20-year and 20- to 30-year nominal coupon sectors, in effect through November 4, 2026; Treasury describes the program as liquidity support). Market reaction from Axios, “Treasury to double down on buybacks to steady bond market,” August 19, 2026 (30-year yield falling as much as 0.1 percentage point on the announcement, then retracing most of the move). The characterization of purpose is Treasury’s; the read on what it can and cannot accomplish is Oakdale’s. home.treasury.gov/news/press-releases/sb0607 · axios.com
Freddie Mac Multifamily, Lock Options (a fixed-rate coupon comprises a Treasury index plus a spread; Index Lock allows a borrower to lock the Treasury index separately from the spread, which is otherwise locked concurrently at rate lock). mf.freddiemac.com/financing/lock-options
Oakdale Capital’s own experience across recent collections matters, compared against the North Carolina Judicial Branch, Landlord/Tenant Issues, and state summary ejectment practice guidance as a representative statutory sequence (ten-day demand for rent; small claims hearing generally one to two weeks after filing; ten-day appeal window; writ of possession and sheriff removal within approximately five days thereafter). The three-month figure is our observed elapsed time, not a statutory baseline, and timelines vary materially by state and by county. nccourts.gov/help-topics/housing/landlordtenant-issues
Oakdale Capital portfolio data and internal meeting records, July through early September 2026. Figures are unaudited, are point-in-time readings that move week to week, and reflect two properties rather than the portfolio. The comparable-community retention figure is the benchmark our property managers report and has not been independently verified by Oakdale; as the following paragraph notes, retention denominators are not standardized across operators. Property names, residents and counterparties are omitted deliberately.
In-House Plumbing Company, Cast Iron Pipe Life Expectancy (expected service life of approximately fifty years, with corrosion, soil movement, chemical drain cleaners and interior scaling as the principal accelerants), and American Society of Home Inspectors, Plumbing Pipes (noting that considerably older cast iron can remain serviceable and recommending condition assessment, including camera inspection, rather than reliance on age), and How to Look at a House, “When did they stop using cast iron pipe in houses?” (cast iron used extensively for drain-waste-vent piping until the mid-1970s, when PVC pipe became widely available and accepted). Trade sources, presented as general engineering expectations rather than property-specific findings. inhouseplumbingcompany.com · howtolookatahouse.com · homeinspector.org/reporter-articles/plumbing-pipes
