The Hike Came. Now What?

The Fed raised rates for the first time in three years and the 10-year Treasury hit its highest close since 2002. Debt costs above 6% are resetting what buyers can pay and increasing pressure on owners with loans coming due. Here’s what stood out in September, and how we’re reading it.
This month we are discussing the interest rate topic all the way through. Last month we called September 16 a coin flip and noted that fixed-rate agency loans were pricing near 6%. Then the Fed hiked. Below we cover what changed, how it shifts what buyers can pay, what it means for the buildings we already own, and where we see openings and risks.
The hike came
On September 16 the Federal Reserve raised its target range for the federal funds rate by a quarter point to 3.75% to 4.00%, on a 12 to 0 vote [1]. It was the first increase in 1,148 days [2]. Chair Kevin Warsh gave three reasons: the economy is strong, inflation has not improved, and the Iran war is pushing up oil prices [3]. The August numbers backed him up. Consumer prices rose 3.4% from a year earlier, gasoline was up 27.4%, and shelter rose 3.0% [4]. Retail sales also jumped 1.2% in the month [5], against a 0.8% forecast [6].
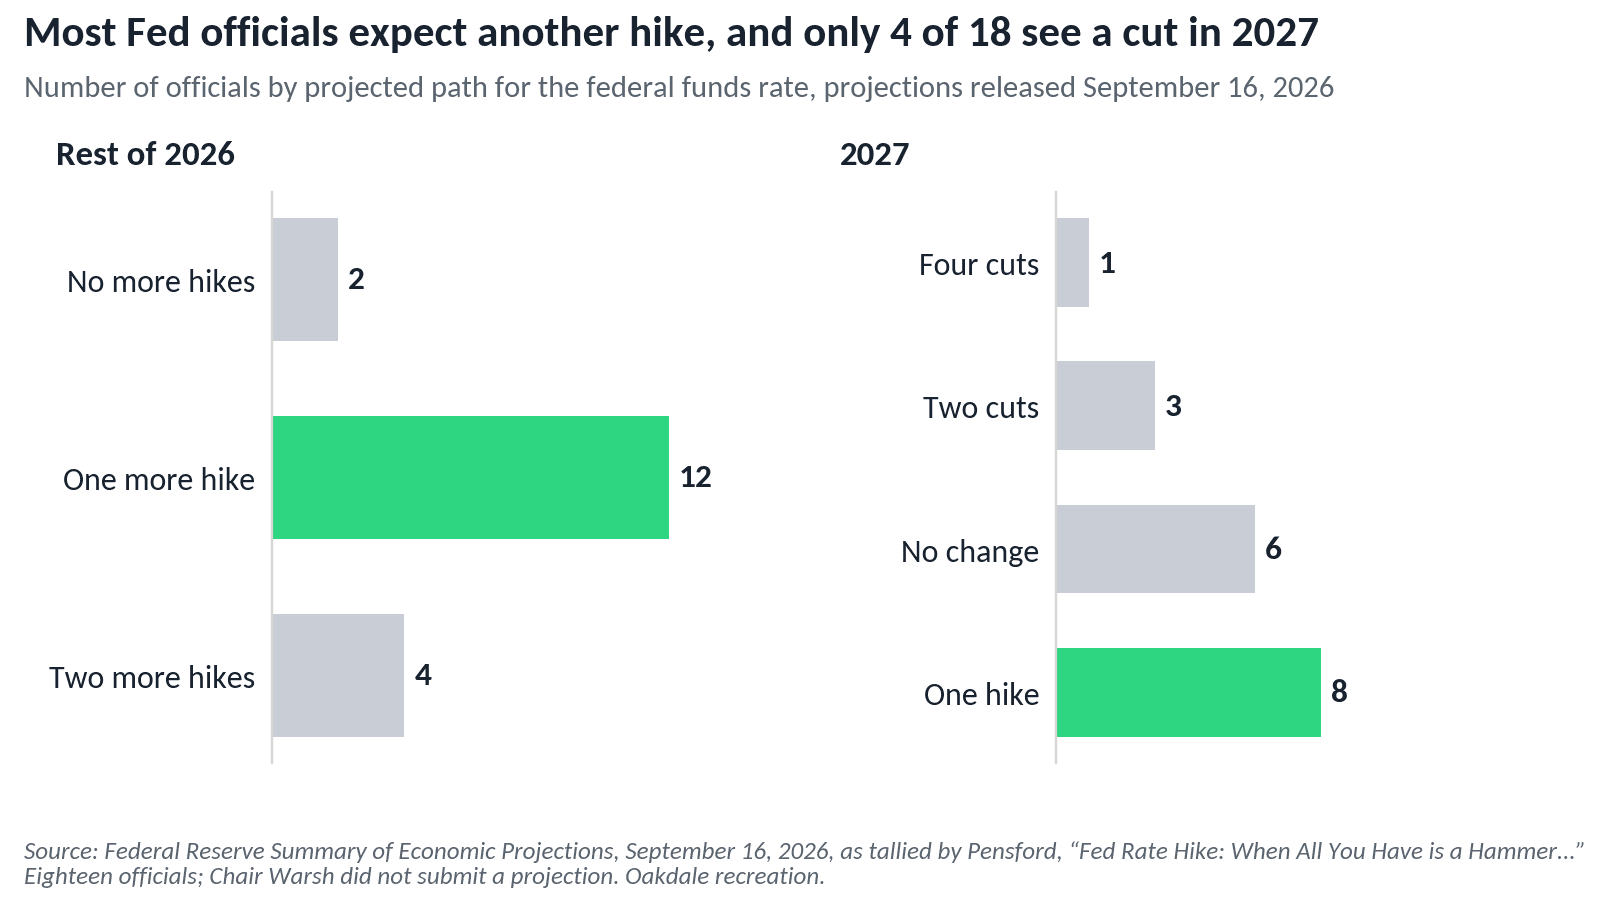
The concern is that higher energy costs could spread into broader inflation. The Fed said the hike will support a timelier return to its 2% goal [1]. More increases are expected, as twelve of eighteen officials see one more hike this year and four see two [2].
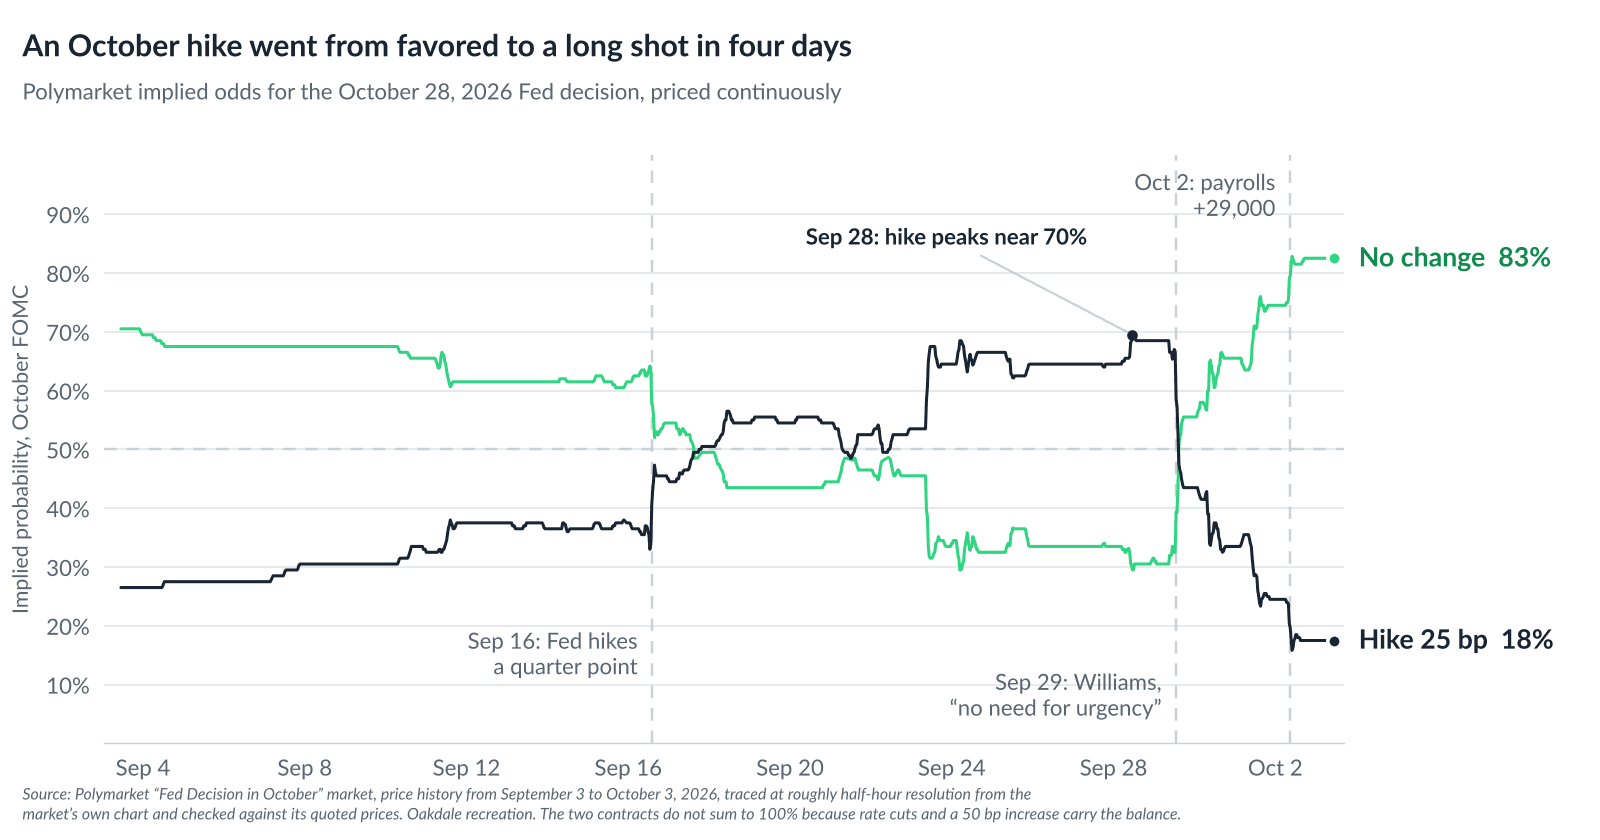
The timing is what moved. Polymarket’s October contract, which has traded more than $24 million, priced a hike near 70% on September 28 [7]. The next day, New York Fed President John Williams said there was “no need for urgency” [8]. On October 2, the September jobs report showed employers added just 29,000 jobs and unemployment ticked up to 4.2% [9]. By October 3 the same contract priced a hike at 18% and no change at 83% [7]. Futures pricing moved the same way, to about 23% on October 2 from about 64% a week earlier [10]. Williams added that one more increase “may be appropriate late this year,” [8] so we read the shift as a question of timing rather than direction. As of October 5, fed funds futures still priced about one full hike by December 9 and about three by June 2027 [11].
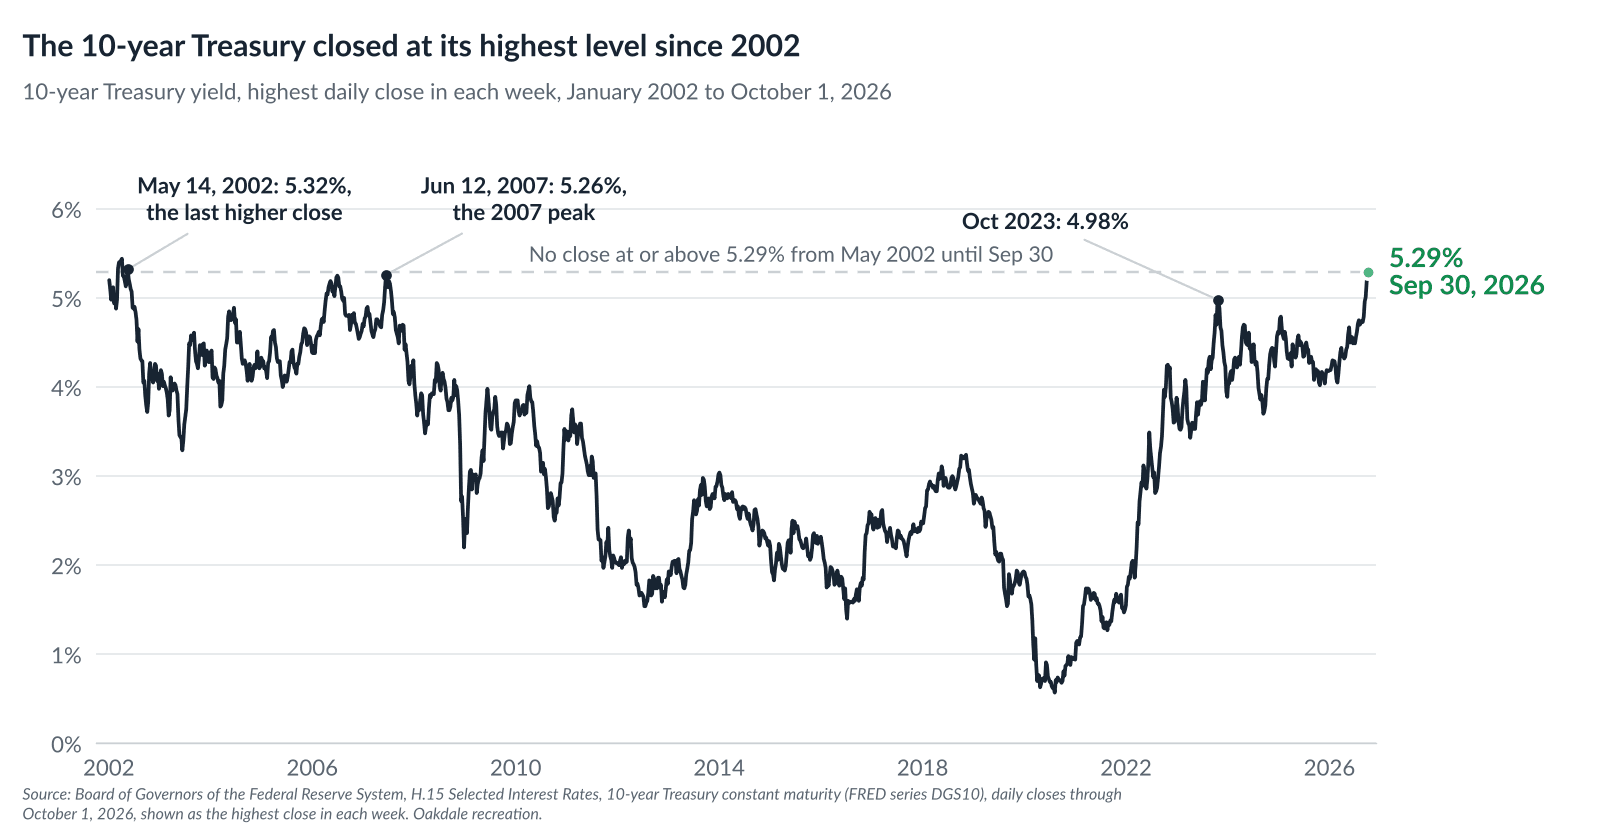
For fixed-rate commercial real estate debt, the 10-year Treasury is one of the key benchmarks, because many longer-term mortgage rates move with Treasury and swap markets. It closed at 5.29% on September 30, its highest close since 2002, and was 5.28% on October 2. The 30-year closed at 5.64% on September 30, also its highest close since 2002, and the 10-year’s 85 basis point rise in the third quarter tied for its largest quarterly increase since early 1994 [12]. By the day of the hike, the 10-year was up 1.34 percentage points since the first U.S. strike on Iran [2].
A softer expected path for the Fed has not brought long-term rates down, a reminder that Fed policy anchors the short end of the curve, not the 10-year Treasury. In the week to October 5, 2-year swap rates fell 3 basis points while 10-year swap rates rose 9 basis points [6], and Greystone’s pricing desk attributes the rise in long-term yields partly to a global selloff in government bonds and heavier debt issuance in the U.S., Europe and Asia [3]. Forecasters still expect relief that markets are not reflecting: the median forecast in a Bloomberg survey of about 50 analysts has the 10-year at 4.75% at the end of this year and 4.50% by the end of 2027, while the forward curve implies about 5.50% a year from now [11].
For now, we are planning around a 10-year Treasury above 5%. We underwrite to the rates in front of us, not to a forecast of where they go next.
Debt is setting the price again
Fixed-rate Fannie Mae and Freddie Mac loans on Greystone’s October 5 rate sheet ran about 6.1% to 7.0%, up from about 5.8% to 6.6% on September 21 [3]. At the same equity return target, buyers have to offer less for an asset or bring more equity to close.
As expected, trades have slowed. One large REIT merger lifted August apartment sales to $80.5 billion, but sales of individual properties fell 35% from a year earlier, before the hike, and apartment prices were down 4.7% [13]. We expect even fewer trades through year-end. Owners who do not have to sell will wait, and buyers who rely on leverage generally cannot pay what they would have before the hike. Our own pipeline shows it. We are testing deals against higher exit caps. On one deal we set a higher exit cap and a higher target return and let the price fall where it may. On another, the seller offered to let the buyer take over its existing loan, which carries a lower rate than anything available today, and we are re-testing the deal on that basis. On a third, every price that works for us falls below what the owner still owes its lender.
Debt is setting the price. In our pipeline, the deals worth pursuing come with debt cheaper than what can be had in today’s market, or with a seller willing to take a lower price.
What it means for the buildings we own
How much an interest rate increase impacts an owned building depends on how its debt is structured. A fixed-rate loan does not change until it matures. A floating-rate loan is priced off the Secured Overnight Financing Rate (SOFR), whose 30-day average was 3.76% through October 2 [14] and generally moves with short-term policy rates. A rate cap limits how high that rate can go, but caps expire, and a replacement costs more every time the forward curve moves up. At refinancing, a higher fixed rate produces a smaller loan, because the same income supports less debt.
Income is a separate question. In markets with enough demand, landlords may be able to grow rents even while financing costs rise. Higher financing costs can also slow new construction, and the August data are consistent with that pressure. Housing starts fell to a 1.275 million annual pace in August, below the 1.32 million forecast [3], and the decline was driven by multifamily construction: starts in buildings with five or more units fell 22.5% from July [15]. The National Association of Home Builders confidence index slipped to 32 in September [3]. Fewer starts today mean fewer new buildings competing with ours in the years ahead.
One tempering note: rents do not always keep pace with inflation, and when oil and interest rates climb together, a recession has often followed [2]. A recession would slow rent growth at the same time it cuts supply. So we test every business plan against today’s curve, and on live deals we are collecting quotes from banks and non-agency lenders alongside Fannie Mae and Freddie Mac.
A hike reprices floating-rate debt quickly. Fixed-rate debt feels higher rates at refinancing.
Opportunities and threats
Many loans written when interest rates were lower are now coming due at today’s rates, and that pressures the owners and lenders holding them. We are seeing it in our pipeline: on one asset, the owner’s loan balance is higher than what the building would sell for today, and the lender plans to bid at the foreclosure sale and take the property back, after which we expect it to be a motivated seller. Owners and lenders facing that math are the sellers we want to buy from.
The loan market is adjusting too. Greystone is now marketing a five-year fixed-rate loan with interest-only payments for the full term, up to 75% of value, and a prepayment penalty that steps down each year, plus a mini-bridge program that funds 90% of expected U.S. Department of Housing and Urban Development (HUD) loan proceeds, about 60 to 90 days into the process but several months prior to when the HUD loan would close [3]. The fine print matters: the five-year loan requires yearly income of at least 7.75% of the loan amount, so for any building bought at a yield below 5.8%, the loan comes in under 75% of the price. In our view, short, flexible loans are becoming more attractive because many borrowers are reluctant to lock in rates above 6% for ten years. That does not necessarily mean staying floating. Given the uncertainty and volatility we expect over the next two to three years, paying up for five-year fixed-rate debt with a rate buydown can also be prudent.
The risks are also clear. If the 10-year keeps climbing, all else equal, asset values face more downward pressure. Floating-rate borrowers pay more each time the Fed moves, and replacement rate caps take a bigger share of cash flow. And a soft jobs report has lowered the odds of an October hike, but most Fed officials still expect one more this year.
We buy capital-structure distress, not fundamental distress. Higher rates put that pressure on owners and lenders with loans coming due.
Closing Thought
Higher rates lower what a leveraged buyer can pay, slow trading, and squeeze owners with loans coming due. They can also slow new supply. That favors buyers who have equity ready and no deadline forcing them to transact.
Our strategy fits this moment. We underwrite to today’s capital costs. We favor supply-constrained submarkets with durable demand. We prefer existing assets and adaptive reuse over ground-up construction. And we buy capital-structure distress, not fundamental distress. We expect fewer sellers by choice and more by necessity, and we intend to be ready for them.
As always, please reach out with questions or to discuss what we’re seeing in our active markets.
Sources
Federal Reserve, “Federal Reserve issues FOMC statement” (Federal Open Market Committee), September 16, 2026 (federal funds target range raised 25 basis points to 3.75% to 4.00%; 12–0 vote). federalreserve.gov/newsevents/pressreleases/monetary20260916a.htm
Pensford, “Fed Rate Hike: When All You Have is a Hammer...,” FOMC Update, September 16, 2026 (first hike in 1,148 days; Summary of Economic Projections tally of 18 officials, Chair Warsh not submitting: rest of 2026, 2 no more hikes, 12 one more, 4 two more; 2027, 1 four cuts, 3 two cuts, 6 no change, 8 one hike; 10-year Treasury up 134 basis points since the first strike on Iran; rates and oil rising together as a recession warning). The chart is an Oakdale recreation of that tally. pensford.com
Greystone, Market Commentary and multifamily rate sheets, September 21, September 28 and October 5, 2026 (Chair Warsh’s stated reasons for the hike, September 21 commentary; fixed-rate Fannie Mae and Freddie Mac quotes of about 6.1% to 7.0% on the October 5 sheet and about 5.8% to 6.6% on the September 21 sheet, assuming a $20 million loan; October 5 commentary attributing the rise in long-term yields partly to a global selloff in sovereign debt and heavier government debt issuance in the U.S., Europe and Asia; Express Execution terms of 5-year fixed, full-term interest-only, up to 75% loan to value, 1.10x debt service coverage, 7.75% minimum debt yield, step-down prepayment; 90 at 90 HUD bridge terms; August housing starts consensus forecast of 1.32 million; National Association of Home Builders Housing Market Index of 32 for September). The 5.8% yield threshold is an Oakdale calculation from the 75% and 7.75% terms, not a quote. greystone.com
U.S. Bureau of Labor Statistics, Consumer Price Index, August 2026, released September 11, 2026 (all items up 3.4% year over year; gasoline up 27.4%; shelter up 3.0%). bls.gov/news.release/cpi.nr0.htm
U.S. Census Bureau, Advance Monthly Sales for Retail and Food Services, August 2026, released September 16, 2026 (retail and food services sales up 1.2% from July). census.gov/retail/sales.html
KPM Financial, “Weekly Rate Update and Forward Curve,” September 21 and October 5, 2026 (consensus expectation of 0.8% for August retail sales, September 21; 2-year swap rates down 3 basis points and 10-year swap rates up 9 basis points in the week to October 5). kpm-financial.com
Polymarket, “Fed Decision in October” market, accessed October 3, 2026 (no change 83%, 25 basis point increase 18%, decreases and a 50 basis point increase each under 1%, on about $24.3 million of volume; a hike peaking near 70% on September 28). The chart is an Oakdale recreation of the market’s own price history, traced at roughly half-hour resolution and checked against its quoted prices; the two contracts do not sum to 100% because rate cuts and a 50 basis point increase carry the balance. A point-in-time reading of market sentiment, not a forecast. polymarket.com/event/fed-decision-in-october-20260617190323537
John C. Williams, President and Chief Executive Officer, Federal Reserve Bank of New York, “Unwavering Dedication,” remarks at the University at Buffalo, September 29, 2026 (“With the policy action we took at our September meeting, there is no need for urgency, and we have time to gather more information”; “One further upward adjustment of the federal funds target range may be appropriate late this year”). newyorkfed.org/newsevents/speeches/2026/wil260929
U.S. Bureau of Labor Statistics, “The Employment Situation, September 2026,” released October 2, 2026 (nonfarm payrolls up 29,000; unemployment rate 4.2%). bls.gov/news.release/empsit.nr0.htm
CME FedWatch, as reported by Kiplinger, “Nasdaq Adds 319 Points as Rate-Hike Odds Ebb: Stock Market Today,” October 2, 2026 (probability of an October 28 hike of 22.7% at the close, down from 64.2% a week earlier). A point-in-time reading of futures pricing, not a forecast. kiplinger.com/investing/stocks/nasdaq-adds-319-points-as-rate-hike-odds-ebb-stock-market-today
Walker & Dunlop, “Forecasts & Forwards” and “Fed Funds Forecasts,” October 5, 2026, using Bloomberg data (fed funds futures pricing about 1.03 cumulative quarter-point hikes by December 9, 2026 and 3.04 by June 9, 2027; median analyst forecast for the 10-year Treasury of 4.75% for the fourth quarter of 2026 and 4.50% for the fourth quarter of 2027, from about 50 responses; 10-year Treasury forward rate of 5.50% one year out). A point-in-time reading of market pricing and analyst forecasts, not an Oakdale forecast. walkerdunlop.com
U.S. Department of the Treasury, Daily Treasury Par Yield Curve Rates, September 30 and October 2, 2026 (10-year 5.29% and 5.28%; 30-year 5.64% and 5.63%). The historical comparisons use the same constant maturity series as published in the Federal Reserve’s H.15 release (FRED series DGS10 and DGS30, daily closes through October 2, 2026): the last higher 10-year close was 5.32% on May 14, 2002, and the 2007 peak was 5.26% on June 12, 2007; the last higher 30-year close was 5.66% on July 8, 2002; the 10-year rose from 4.44% on June 30 to 5.29% on September 30, an 85 basis point rise that ties the fourth quarter of 2016 and the third quarter of 2022 as the largest quarterly increase, measured from quarter-end closes, since the first quarter of 1994 (94 basis points). The chart is an Oakdale recreation of the 10-year series, shown as the highest close in each week. home.treasury.gov/resource-center/data-chart-center/interest-rates
MSCI Real Assets via Multifamily Dive, “Vivmark boosted August volume, but apartment prices fell 4.7% YOY,” September 24, 2026 (August apartment sales of $80.5 billion, lifted by the Equity Residential and AvalonBay merger; individual asset sales down 35% year over year; RCA CPPI for apartments down 4.7% year over year). multifamilydive.com/news/vivmark-multifamily-merger-apartment-transaction-10-year-treasury/831282/
Federal Reserve Bank of New York, SOFR Averages and Index, as published in FRED series SOFR30DAYAVG, October 2, 2026 (30-day average SOFR 3.76%). newyorkfed.org/markets/reference-rates/sofr-averages-and-index
U.S. Census Bureau, New Residential Construction, August 2026, released September 17, 2026 (total starts at a 1,275,000 annual rate; starts in buildings with five units or more at 344,000, down 22.5% from July). census.gov/construction/nrc
This letter is for informational purposes only and does not constitute an offer to sell or a solicitation of an offer to buy any securities. Forward-looking statements are based on current market conditions and may change. Nothing herein guarantees future results or the availability of any investment or acquisition opportunity. Past performance is not indicative of future results. All charts are Oakdale Capital recreations of third-party data and reflect approximate or illustrative figures. Market data is believed to be reliable but has not been independently audited. Oakdale Capital · Chicago, Illinois.
